Listening to data

We understand the importance of basing our decisions on solid data and presenting it in a clear and useful manner.
By doing so, we can provide a better overview of municipal services for the benefit of residents and staff.
Data service
The City's Data Service also operates within the Department of Services & Innovation, driving our use of data for decision-making and improved service. This is achieved by ensuring the quality, reliability, and access of residents and staff to correct and reliable data and data analysis.
Examples of products are:
- statistical analysis and reports
- model development and implementation
- apps and dashboards
- visual data representation
- and so much more!
Data warehouse
One of the largest projects of the Data Service is the development and construction of a data warehouse for Reykjavík City. The data warehouse is a digital storage place for all of Reykjavík City's data, where data from the various systems used by the City can be collected.
The project is based on data lake technology and greatly facilitates access to the City's operating data since everything is now in one place. The warehouse is already in use, although work on it will continue over the next few years.
Data processing center
Data Services have worked diligently to set up a data processing center for the City. This center provides a coordinated development and operational environment for data running in the Azure cloud. Here programming of analytics solutions, their execution, and their publication all happen in the same place.
It enables the creation of dashboards, statistical models, map applications, and other essential solutions that directly benefit the City's employees and residents. The data processing center is now in use and will be further developed in the upcoming years.
Apps and dashboards
Through clear data presentation in dashboards and apps, we enable employees and city residents to gain insight into the City's operations.
This also supports the start-up community by promoting the use of reliable data for different innovative solutions.

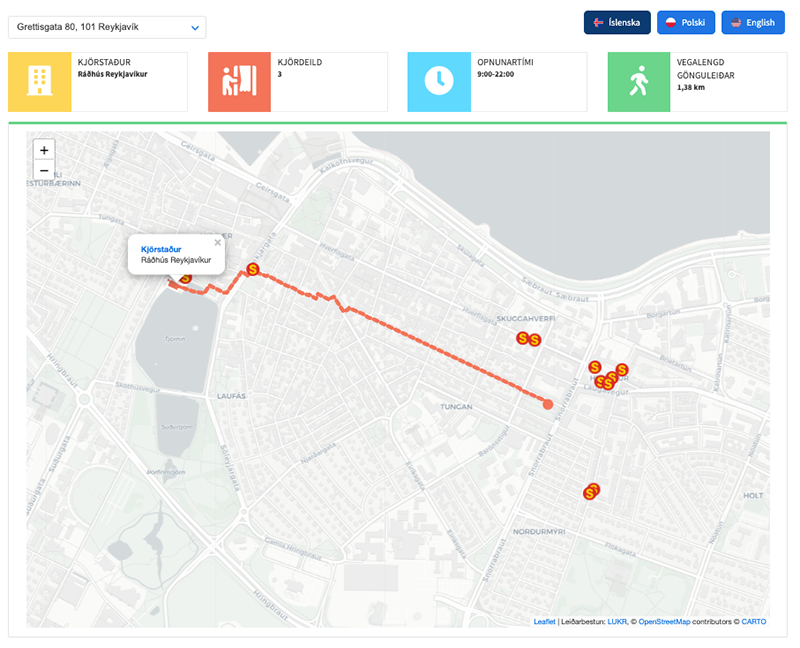
Election map app
Where should I vote? We have an answer! The election map app provides an overview of polling locations in the city, distances, and the best walking routes based on your address. Input your address and find out exactly where to vote, in which polling ward, when it's open, and how long the walking distance is. The one thing we can't tell you is who you should vote for.
The app is developed by Data Services. The algorithms come from the City's geographic information system (LUKR) and handle the calculations of the best routes.

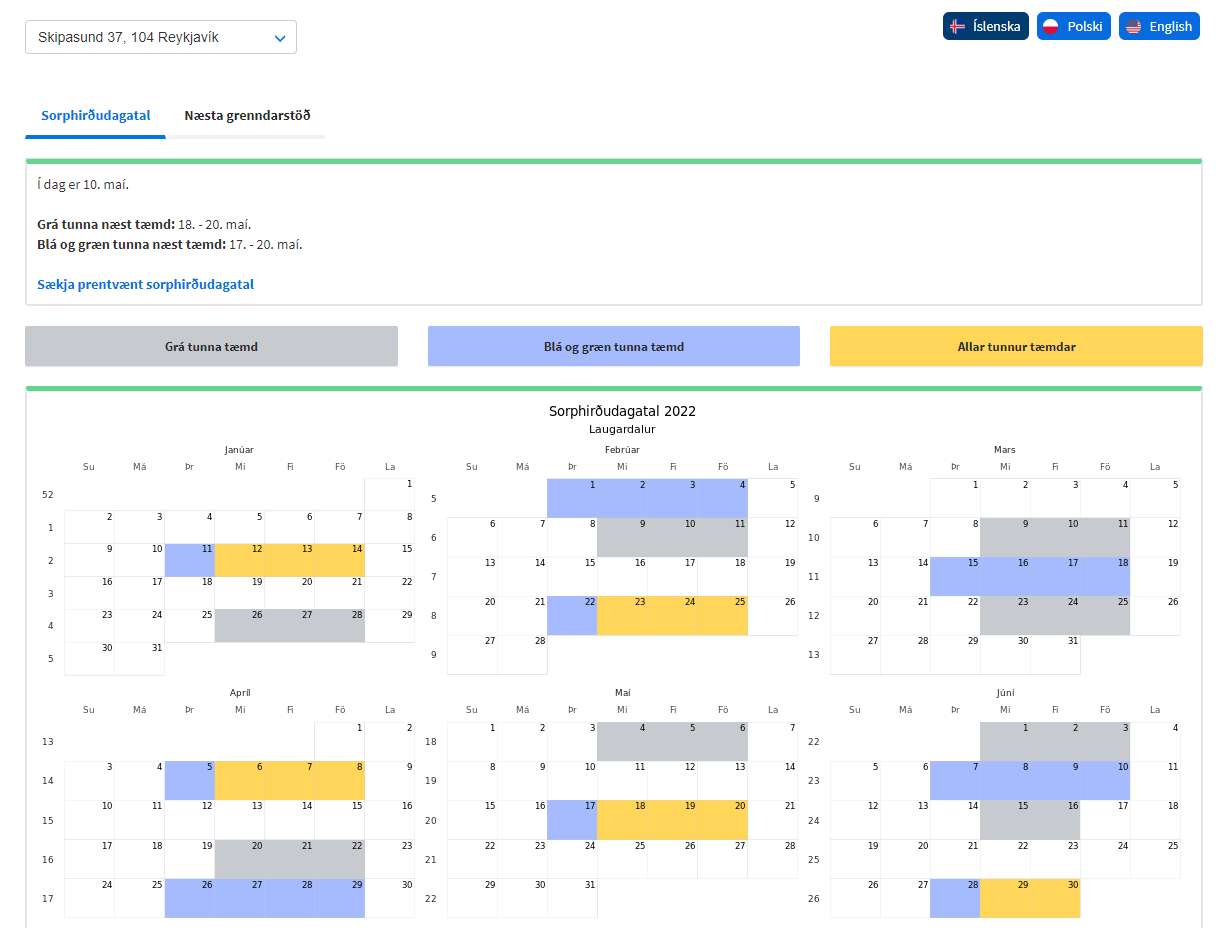
Waste collection calendar and community recycling bins
Reykjavík City has now implemented a new online waste collection calendar. The solution is user-friendly and lets residents find out when the next waste pickup at their home will be, by entering their address.
The solution also includes a map app showing the location of community recycling bins nearest to people's homes.

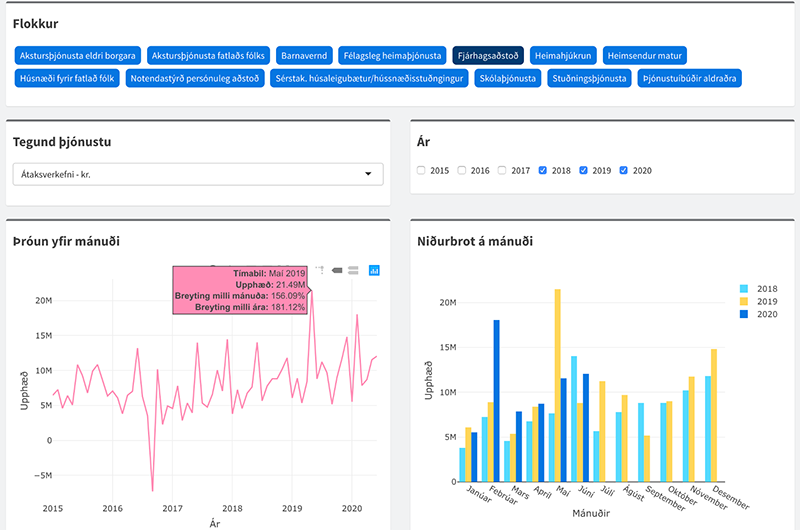
Welfare service dashboard
This dashboard displays key figures related to the Department of Welfare's services, making it easier for employees and other interested parties to keep track of the status and development of welfare matters in the city.
The project was developed in the data processing station, with heavy emphasis on visual presentation. You can easily download content from the website in the form of images, Excel, or CSV.
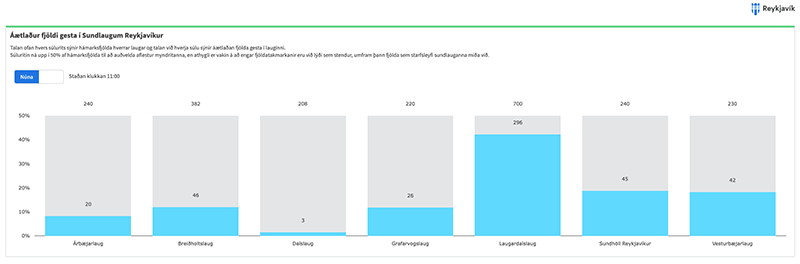
Real-time swimming pool guest numbers
Due to group size limits of people and closures durig Covid, there was a sudden increased need to be able to see the real-time number of swimming pool guests and assess the capacity of swimming pools at any given time.
To meet this need, real-time figures of swimming pool guests were put on the website, allowing residents and pool staff to easily determine whether there was space in the pool each time.

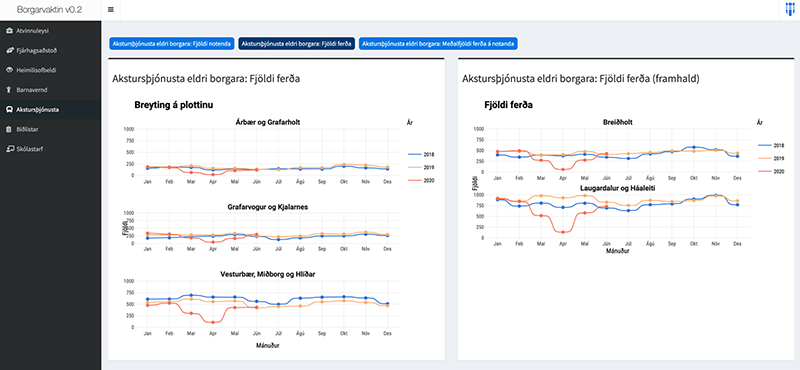
Dashboard for the Activity and Support Team
- The Reykjavík Activity Support Team (AMV) is part of the "Let's Start Working" initiative, which aims to create 7,000 jobs in the community.
- The dashboard contains unemployment figures and figures on nationwide financial assistance.
- It also has figures on the number of people hired through the Activity Support Team for example, by gender, nationality, age, industry and company, and the grants provided.
- The dashboard also shows various figures in operations, such as the number of "touches" with an individual (email, phone call, interview, meeting, hiring).
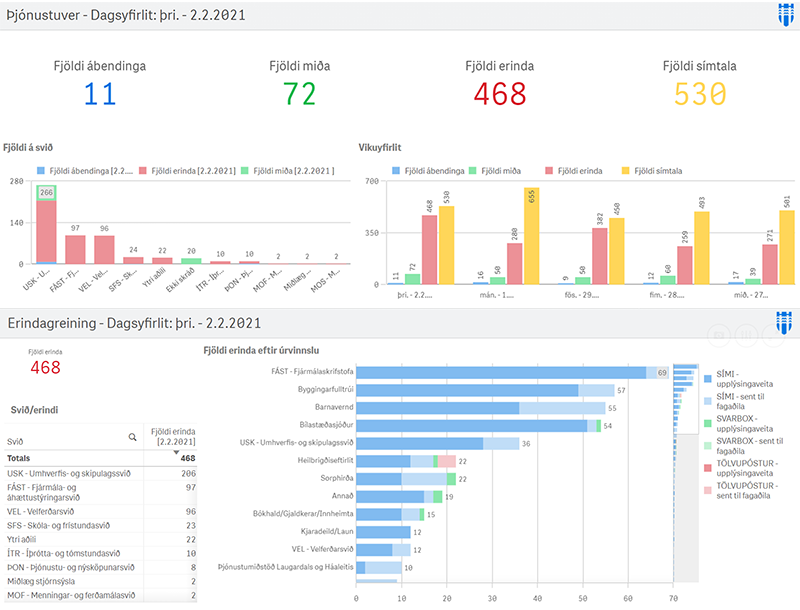
Service center dashboard
- An extensive dashboard that makes the operation of the Service Center data-driven by showing the main key figures of its operation.
- The dashboard is designed for Service Center staff and department managers of the city, providing important insight into the city's services and the challenges found there.
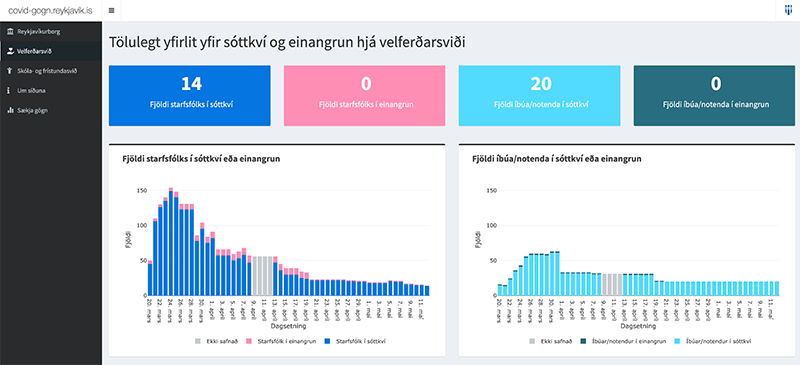
Covid-19 dashboard
- The Covid-19 dashboard showed how the effects of the Covid-19 pandemic emerged in the City administration.
- Among other things, the dashboard allowed you to view figures on quarantine and isolation and their development in real time.
- The dashboard was widely used and greatly facilitated responses and steering of affairs, for example with regard to group size limits.
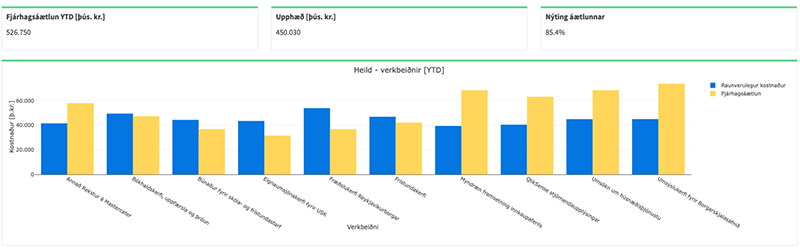
Dashboard for the Real Estate Fund
- The Real Estate Fund manages the City's assets and finances all construction projects on its behalf.
- The dashboard shows booked cost alongside cost projection in the Real Estate Fund.
- It is possible to see booked costs over time, for project clusters, and down to individual projects, along with corresponding cost projection.
- It is also possible to view the corresponding output forecasts for each project, project categories and the entire Real Estate Fund.
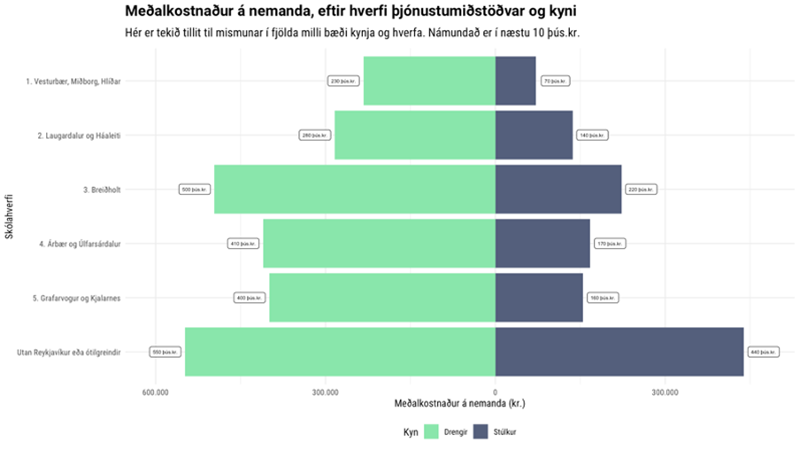
Cost analysis of specific services
- An extensive analysis project examining the specific services of the Department of Education and Youth (SFS) and Department of Welfare (VEL) for individual children.
- Detailed analyses were carried out by school district, gender, and district, which involved merging data from SFS, VEL and Registers Iceland.
- Due to the nature of the project, it was very important to prioritize privacy and handle all data carefully.
- The specialist knowledge of the Data Service was very important here in completing the project.
Screenshots